Below my (Mac specific) working notes for working with the new ExtendScript debugger plug-in for VSCode. I decided to put these out in the open and hope to save someone some frustration.
Your mileage may vary. I find it currently very hard to use because it is brittle and there is no end to crashes, lockups, and general wonkiness.
Switching from ESTK to VSCode:
- Replace ‘#’ for directives with ‘//@’:
#targetengine->//@targetengine
etc… - Add your parent folder with your script or scripts to a new workspace in VSCode. Save the workspace file somewhere close by.
- Create a
.vscode/launch.jsonfile in the workspace folder.
App"targetSpecifiers” are as in ESTK.
Examples:indesign-14.064-> 14 refers to InDesign CC 2019, 064 refers to it being a 64 bit version.illustrator-23.064-> 23 refers to Illustrator CC 2019, 064 refers to it being a 64-bit version.
And so on…
For the path to the script I right-click the .jsx file in workspace source tree view in the left hand side of the VSCode window.
Select Copy Path from the context menu, then paste it into thelaunch.jsonfor the"program"property.
Example launch.json that I use to start with:
{
 "version": "0.2.0",
 "configurations": [
 {
 "type": "extendscript-debug",
 "request": "launch",
 "dontBreakOnErrors": true,
 "targetSpecifier": "indesign-14.064",
 "engineName": "whateverengine",
 "name": "A name",
 "program": "pathToTheScript",
 "stopOnEntry": false
 }
 ]
 }
- In VSCode, switch to Debug mode (click the bug icon in left hand toolbar)

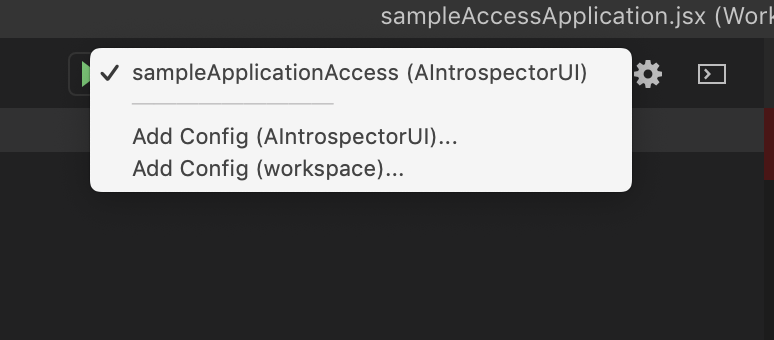
- Click the popup right of the green ‘Play’ button at the top, and select a config that you listed in the launch.json

- Make sure ESTK is not running. If it is running, you’ll get
(#15) Can’t initialize target
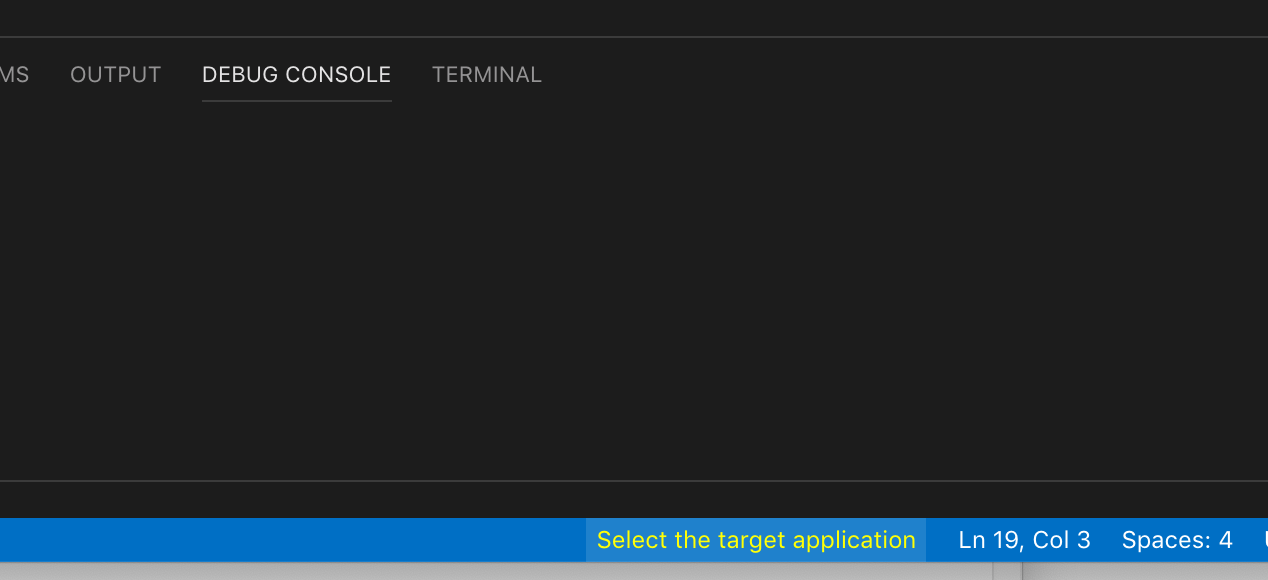
in the next step. - In VSCode, click at the bottom, on the yellow
Select the target Application
- If ESTK is not running but you still get
(#15) Can’t initialize target
you need to quit VSCode and on the command line, runkillall "Code Helper"
Restart VSCode, then try selecting target application again as before. - If you get
(#15) Cannot execute script in target engine ‘…’!
It most often indicates a syntax error or so. The fun bit is when it comes to //@include files: VSCode will not report any issues (so all seems well), but it will refuse to run. If that’s the case, you need to open all include files and hunt for the error. Or launch ESTK, which does report the issue straight away. - For debugger versions before 1.1.0: If you get
Cannot debug Error #1116
you might have inadvertently upgraded to VSCode >= 1.33 which is incompatible. - If so, first turn off automatic updates in VSCode. Switch them off now, or it will immediately re-update as soon as you install VSCode 1.32.
- Then downgrade to VSCode 1.32
https://vscode-westeu.azurewebsites.net/updates/v1_32 - Once it’s all good, click the green ‘Play’ button at the top.
- If your find things start to go wonky (e.g. you cannot inspect certain variables any more or other general wonkiness), you need to start over. Quit your target app, quit VSCode, do the killall…
Useful links
Cannot initialize target:
https://forums.adobe.com/message/10952076#10952076
Version 1.32 of VSCode (1.33 is broken)
https://vscode-westeu.azurewebsites.net/updates/v1_32
Forum
https://forums.adobe.com/community/creative_cloud/add-ons/extensions
ESTK Cannot debug Error #1116
https://medium.com/adobetech/workaround-for-extendscript-toolkit-debugger-error-1116-f067f81f96c6
https://medium.com/adobetech/extendscript-debugger-for-visual-studio-code-windows-compatible-prerelease-f1537375c3f6
Prerelease forum
https://forums.adobeprerelease.com/exmancmd/categories/estkvsc
ReadMe
https://forums.adobeprerelease.com/exmancmd/discussion/42/extendscript-debugger-for-macos-readme/p1