When working on extensions for the Adobe Creative Suite, you can use Chrome as a debugger.
When debugging is enabled, your extension will open up a port, and then you point your browser to http://localhost:<whateverport> to get to the debug interface.
Sadly enough, this stuff is kind of ‘broken-ish’ (see http://raspi.rwf.co/brokenish.html).
For example, you cannot type in the console to inspect stuff, so debugging is a bit frustrating.
Ole Kvern mentioned on the Slack group (adobedevs.slack.com) that a lot of this pain and suffering can be alleviated by using a slightly older cefclient instead of Chrome. See http://opensource.spotify.com/cefbuilds/index.html and look around in the older builds.
I did that and it works a treat.
I prodded and poked around a bit in the available builds, and found that version 51.0.2704.47 works OK for me. There might be more recent versions that work too, but I called ‘good enough’ on this one, and I did not put in any more time.
However, I am lazy. So here’s a little hack I performed. It’s nasty, but it works. I am using a Mac. I assume a closely related similar hack would be possible on Windows.
I only use this cefclient app to do CEP debugging, so I have no qualms making a hacked mongrel version to suit my needs.
For it to work, your debug URL must be exactly 21 characters long (e.g. http://localhost:8070 or suchlike. That means: you want to use a 4-digit port number in your .debug file).
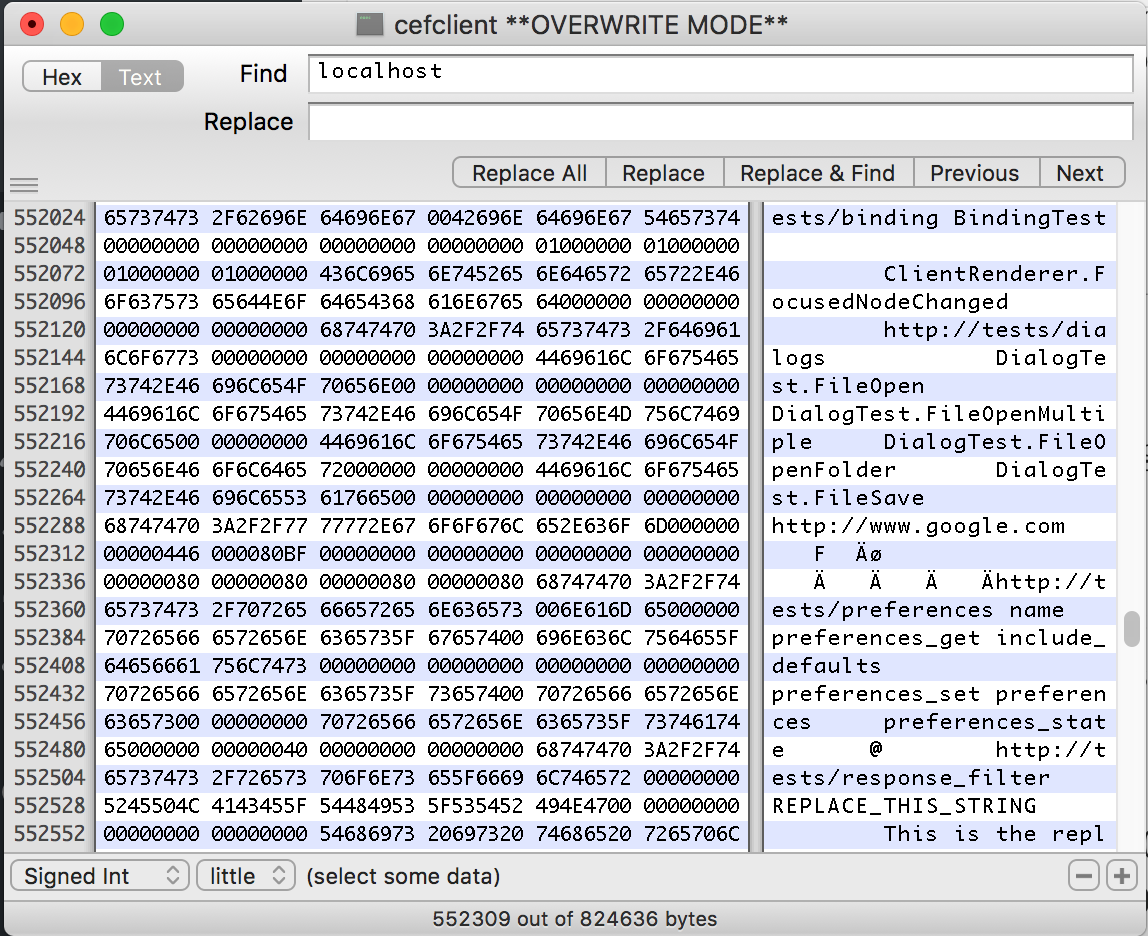
Open the cefclient binary with a Hex Editor (on Mac, it is at …/cefclient.app/Contents/MacOS/cefclient ).
Search for the text ‘http://www.google.com’. It occurs twice – you want the one around position 0x552288.
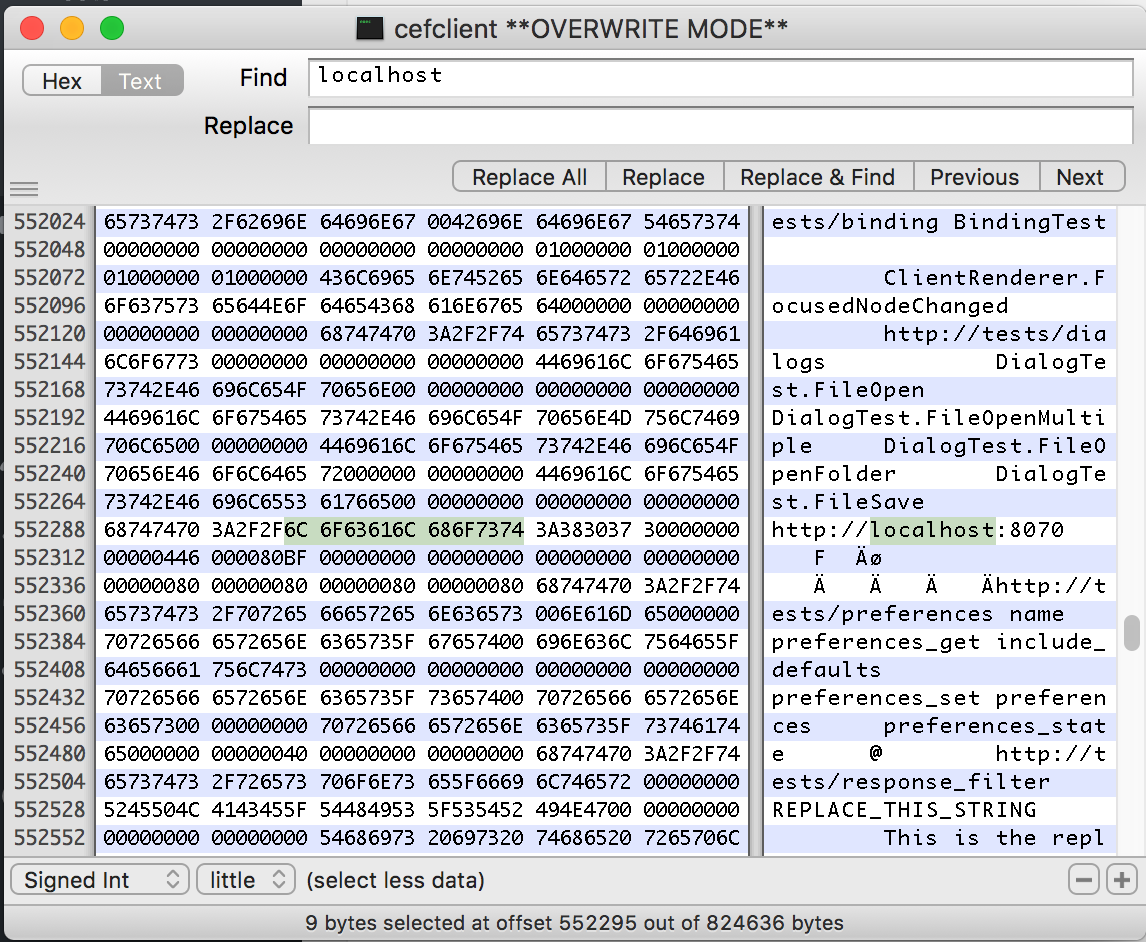
Replace the text with whatever your debug URL. Make sure to not add or remove bytes. You need to overwrite the URL with something of the same length.
Save and Quit.
And now, each time I launch cefclient, it immediately goes to http://localhost:8070.
The clean way to do this would be to make a variant of cefclient that accepts command-line parameters. I might do that at some point; it would allow me to easily add a ‘debug’ button to my extensions and have it launch the debugger. Together with my old ‘dive into it’ hack (https://coppieters.nz/?p=63) that might make for a more seamless debugging experience. For now, this nasty hack will have to do…

